In today’s digital landscape, understanding your website’s performance isn’t just helpful-it’s essential. Whether you’re running an e-commerce store, a service-based business, or a content-driven website, knowing who visits your site, what they do, and why they leave can make the difference between online success and stagnation.
This is where Google Analytics comes in. As the world’s most widely-used web analytics platform, Google Analytics provides powerful insights that help businesses make data-driven decisions. But what exactly is it, and how does it work? Let’s break it down.
What Is Google Analytics?
Google Analytics is a free web analytics service offered by Google that tracks and reports website traffic, user behavior, and conversion data. Launched in 2005, it has evolved into a sophisticated platform that helps businesses understand their online audience and optimise their digital presence.
The current version, Google Analytics 4 (GA4), represents a significant evolution from its predecessor, Universal Analytics. GA4 uses an event-based data model and incorporates machine learning to provide more intelligent insights and better cross-platform tracking capabilities.
Key Features of Google Analytics
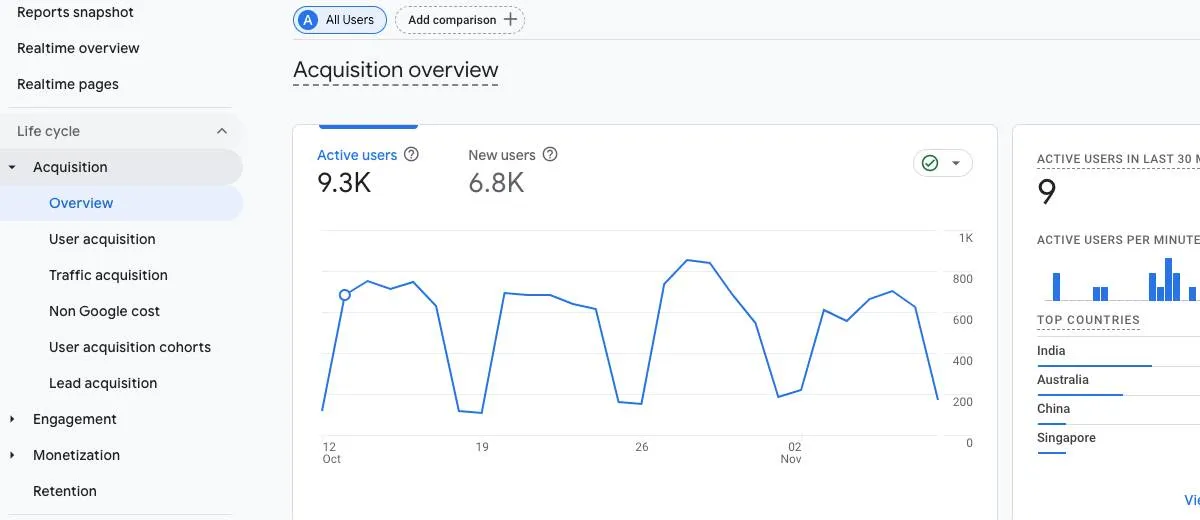
- Real-Time Reporting: See who’s on your site right now, what pages they’re viewing, and where they’re located.
- Audience Insights: Understand your visitors’ demographics, interests, location, device usage, and behavior patterns.
- Acquisition Analysis: Discover how people find your website-through search engines, social media, direct visits, or referral links.
- Behavior Tracking: Monitor which pages users visit, how long they stay, and where they drop off in their journey.
- Conversion Tracking: Measure specific actions that matter to your business, like purchases, form submissions, or downloads.
- E-commerce Analytics: For online stores, track product performance, transaction data, and shopping behavior.
How Does Google Analytics Work?
Google Analytics operates through a systematic process of data collection, processing, and reporting. Here’s how it works behind the scenes:
1. Tracking Code Implementation
The foundation of Google Analytics is a small piece of JavaScript code (the tracking code) that you add to every page of your website. This code, also known as the Global Site Tag (gtag.js) or Google tag, is typically placed in the header section of your website.
When someone visits your site, this code executes in their browser and begins collecting information about their visit.
2. Data Collection
Once the tracking code loads, it starts gathering data about the user’s interaction with your website. This includes:
- Page views and screen views
- Events (clicks, video plays, downloads, etc.)
- User properties (location, device, browser)
- Traffic source information
- Engagement metrics (time on page, scroll depth)
The tracking code collects this data using cookies and browser information, then packages it into small data packets called “hits.”
3. Data Transmission
These data packets are sent to Google’s servers for processing. The transmission happens in real-time as users interact with your site, creating a continuous stream of information about visitor behavior.
Google Analytics uses a measurement protocol to ensure data is transmitted securely and efficiently, even on slow connections.
4. Data Processing
Once Google receives your data, it goes through a processing phase where:
- Raw data is filtered and organized
- Goals and conversions are calculated
- User sessions are defined and grouped
- Traffic sources are categorized
- Machine learning algorithms identify patterns and anomalies
During processing, Google Analytics also applies any filters you’ve configured, such as excluding internal traffic or removing spam referrals.
5. Reporting and Analysis
After processing, the data becomes available in your Google Analytics reports, typically within 24-48 hours (though real-time data appears immediately). You can then access various reports through the Google Analytics interface to analyze:
- How many people visited your site
- Where they came from
- What devices they used
- Which pages they viewed
- How long they stayed
- Whether they completed desired actions
Understanding the GA4 Data Model
Google Analytics 4 introduced a fundamentally different approach to data collection compared to Universal Analytics. Instead of focusing primarily on page views and sessions, GA4 uses an event-based model where every interaction is recorded as an event.
Events in GA4
In GA4, everything is an event-page views, clicks, scrolls, video plays, purchases, and more. Each event can have parameters that provide additional context, such as:
- The page URL where the event occurred
- The value of a transaction
- The name of a file downloaded
- The search term used
This flexible structure allows for more detailed and customizable tracking without requiring custom code for every interaction you want to measure.
User-Centric Measurement
GA4 also emphasises user-centric measurement, meaning it tracks individual users across multiple sessions and devices (when possible). This provides a more complete picture of the customer journey, from first discovery to final conversion.
Setting Up Google Analytics
Getting started with Google Analytics involves several steps:
Step 1: Create a Google Analytics Account
Visit the Google Analytics website and sign up using your Google account. You’ll create an account for your organisation and a property for your website.
Step 2: Install the Tracking Code
Add the provided tracking code to every page of your website. This can be done manually, through a tag management system like Google Tag Manager, or via a plugin if you’re using a content management system like WordPress.
Step 3: Configure Your Settings
Set up important configurations such as:
- Data retention settings
- User permissions for team members
- Data filters to exclude internal traffic
- Enhanced measurement features
- Cross-domain tracking (if applicable)
Step 4: Define Your Goals and Conversions
Identify the key actions you want users to take (purchases, form submissions, phone calls) and set them up as conversion events in Google Analytics.
Making Sense of Your Data
Having data is one thing; understanding what it means is another. Here are some key metrics every business should monitor:
Traffic Metrics
Users: The number of unique individuals who visited your site Sessions: The number of visits to your site (one user can have multiple sessions) Page Views: The total number of pages viewed across all sessions
Engagement Metrics
Average Engagement Time: How long users actively interact with your site Pages Per Session: How many pages a typical visitor views Bounce Rate: The percentage of visitors who leave after viewing only one page
Conversion Metrics
Conversion Rate: The percentage of visitors who complete a desired action Goal Completions: The number of times users complete specific objectives E-commerce Revenue: Total revenue generated (for online stores)
Acquisition Metrics
Traffic Sources: Where your visitors come from (organic search, social media, direct, etc.) Top Referring Sites: Which external websites send you the most traffic Campaign Performance: How your marketing campaigns are performing
Privacy and Compliance Considerations
In an era of increasing privacy concerns and regulations like GDPR and CCPA, it’s important to use Google Analytics responsibly. Consider these best practices:
- Implement a clear privacy policy that explains your data collection practices
- Obtain user consent before tracking where required by law
- Anonymise IP addresses to protect user privacy
- Avoid collecting personally identifiable information (PII)
- Regularly audit your data collection to ensure compliance
Google Analytics 4 was designed with privacy in mind, offering features like cookieless tracking options and automatic data deletion controls.
Why Google Analytics Matters for Your Business
Understanding your website analytics isn’t just about numbers-it’s about making informed decisions that drive business growth. With Google Analytics, you can:
Identify Your Best Marketing Channels: Discover which marketing efforts deliver the highest return on investment so you can allocate your budget more effectively.
Understand Your Audience: Learn who your visitors are, what they’re interested in, and what problems they’re trying to solve, allowing you to create more targeted content and offers.
Improve User Experience: Identify pages with high bounce rates or long load times, then optimise them to keep visitors engaged.
Increase Conversions: Analyse the paths users take before converting, identify bottlenecks in your funnel, and optimise for better results.
Measure ROI: Connect your marketing efforts to actual business outcomes, proving the value of your digital investments.
Getting Started with Google Analytics Today
Google Analytics is a powerful tool that democratises data analysis for businesses of all sizes. While it can seem overwhelming at first, you don’t need to master every feature immediately. Start by focusing on the metrics that matter most to your business goals, and gradually expand your knowledge as you become more comfortable with the platform.
The key is to move from simply collecting data to actually using it to make better decisions. Set aside time each week to review your analytics, identify trends, and test new strategies based on what you learn.
If you’re feeling overwhelmed or want to ensure you’re getting the most from your analytics data, working with a digital marketing professional can help you unlock deeper insights and implement more sophisticated tracking strategies.
Ready to harness the power of your website data? At VEBIT, we help Australian businesses implement and optimise Google Analytics to drive measurable growth. Contact us today to learn how we can help you make data-driven decisions that move your business forward.